Code
Executing The Code
This code was written to be executed in a particular file structure, diagrammed as follows:
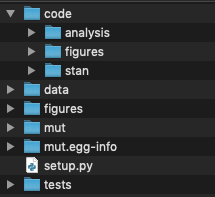
With a GitHub account you can clone a repository with all data and code in place in the correct directory structure. Please follow the installation instructions on the GitHub repository.
Computational Environment
All analysis and data processing was performed with the following software configurations.
# Python Version
CPython 3.6.7
IPython 7.1.1

# Package Versions
bokeh==1.0.4
fcsparser==0.2.0
numpy==1.14.2
matplotlib==3.0.1
scipy==1.1.0
seaborn==0.9.0
pandas==0.23.4
tqdm==4.28.1
pystan==2.18.0.0
python_frontmatter==0.4.5
PyYAML==5.1

# System Information
compiler   : GCC 4.2.1 Compatible Clng 4.0.1 (tagss/RELEASE_401/final)
system     : Darwin
release    : 18.2.0
machine    : x86_64
processor  : i386
CPU cores  : 4
interpreter: 64bit
The mut Module
This work required a moderate amount of home-grown code. To ensure reproducibility, we have written it as a Python module that can be installed from the master branch of the GitHub repository. Please see the installation instructions for details. This module is required to execute all of the following scripts.
Figure Generation
All Figures in this work (save for Fig. 2) were generated programmatically.
Used to generate the data collapse figures shown in Fig. 1C of the main text
Necessary Data Sets- Data from Razo-Mejia et al. 2018
Used to generate Figure 3, illustrating DNA binding mutant data, induction profiles, data collapse and change in free energy.
Necessary Data Sets- Summarized fold-change measurements
- DNA binding energy inference statistics
- Free energy inferred from fold-change measurements
Used to generate Figure 4, illustrating the inducer binding mutant data, induction profiles, data collapse, and change in free energy.
Necessary Data Sets- Summarized fold-change measurements
- Ka and Ki inference statistics
- Allosteric parameter inference samples
- Free energy inferred from fold-change measurements
Used to generate Figure 5, illustrating the double mutant data, induction profiles, and change in free energy.
Necessary Data Sets- Summarized fold-change measurements
- Allosteric parameter inference samples
- DNA binding energy inference samples
- Free energy inferred from fold-change measurements
Used to generate Figure 6, illustrating full data collapse of previous measurements from Garcia and Phillips 2011, Brewster et al. 2014, Razo-Mejia et al. 2018, and this work
Necessary Data Sets- Summarized fold-change measurements
- DNA binding energy inference statistics
- Allosteric parameter inference statistics
- Data from Garcia and Phillips 2011 and Brewster et al. 2014
- Data from Razo-Mejia et al. 2018
Interactive Figures
The two interactive figures associated with this work (the model explorer and the data collapse figure) were generated using the Bokeh plotting framework using a combination of Python code and Javascript. The Python code (which includes the javascript) can be downloaded below.
Inferential Models
All parameter inference was performed using the Stan probabilistic programming language. The following Stan model files perform the described analysis.
- Inference of DNA Binding Energy
Used to estimate the DNA binding energy and homoscedastic error for a single induction profile. -
Global Inference of DNA Binding Energy
Used to estimate the DNA binding energy for a single mutant from multiple induction profiles -
Inference of Inducer Dissociation Constants
Used to estimate the inducer dissociation constants Ka and Ki for a single induction profile, assuming the allosteric energy difference is unperturbed from the wild-type value. -
Inference of Allosteric Parameters
Used to infer the inducer dissociation constants Ka and Ki along with the allosteric energy difference for a single induction profile. -
Global Inference of Allosteric Parameters
Used to estimate the allosteric parameters for a single mutant from multiple induction profiles. - Inference of Free Energy from Fold-Change Measurements
Used to infer the mean fold-change, standard deviation, and free energy for a collection of fold-change measurements.
The following scripts were used to execute the inference models.
- Execution of parameter inference models
Loads the data, calls the inferential models, and save statistics and samples to tidy.csvfiles.- Necessary Data Sets:
- Execution of global parameter inference
models
Loads the data, estimates parameters for each mutant using all induction profiles, and saves samples and statistics.- Necessary Data Sets:
Supplementary Materials
The following code was used to generate the supplementary figures as well as any data generated via simulation.
- Fig. S2: Prior Predictive Checks for DNA Binding Energy and Homoscedastic Error
Used to generate Figure S2 illustrating the prior distributions for the DNA binding energy and homoscedastic error as well as visualize the percentiles of the prior predictive checks.- Necessary Data Sets and Auxiliary Scripts:
- Fig. S3: Prior Distribution Recovery for DNA Binding Energy and Homoscedastic
Error
Used to generate Figure S3 which shows that the prior distributions of the parameters can be recovered through repeated inferential runs on simulated data.- Necessary Data Sets and Auxiliary Scripts:
- Fig. S3 - Fig. S5: Simulation Based Calibration of DNA Binding Energy
Inference
Used to generate three figures (Fig. S3 - S5) which use simulation based calibration to assess the sensitivity and computational tractability of the statistical model for estimating the DNA binding energy.- Necessary Data Sets and Auxiliary Scripts
- Fig. S6: DNA Binding Energy Posterior Predictive
Checks
Used to generate Fig. S6 which shows the MCMC sampling output and corresponding posterior predictive checks for DNA binding mutant Q21M.- Necessary Data Sets
- Fig. S7: Prior Predictive Checks for Free Energy Inference
Used to generate Fig. S7 which plots the percentiles of the prior predictive checks for estimation of the free energy from fold-change measurements.- Necessary Data Sets and Auxiliary Scripts
- Fig. S8: Simulation Based Calibration for Free Energy
Inference
Used to generate Fig. S8 which shows z-scores, shrinkage, and rank distribution for model that infers the free energy from a collection of fold-change measurements.- Necessary Data Sets and Auxiliary Scripts
- Fig. S9: Empirical Free Energy Posterior Predictive
Checks
Used to generate Fig. S9 which shows the MCMC samples and the posterior predictive checks for estimating the mean fold-change for Y20I-Q294K with operator O2 at 50 µM IPTG.- Necessary Data Sets and Auxiliary Scripts
- Fig. S10: Sensitivity Limits for Inferring Empirical Free
Energy
Used to generate Fig S9 which shows the sensitivity limits for inferring the free energy from simulated and real fold-change measurements.- Necessary Data Sets and Auxiliary Scripts
- Fig. S11: Comparison of DNA Binding Energy Inference to Other Repressor Copy
Numbers
Used to generate Fig. S11 which shows the influence of the choice of fit strain on predictions of induction profiles for other DNA binding mutants.- Necessary Data Sets
- Fig. S12: Effect of DNA Binding Energy Fit Strain on ∆F
Predictions
Used to generate Fig. S12 which shows how the choice of fitting strain influences the predicted change in free energy for DNA binding mutants.- Necessary Data Sets
- Fig. S13: Prior Predictive checks for Inference of Allosteric
Parameters
Used to plot percentiles of prior predictive checks for two hypotheses for inducer binding domain mutants.- Necessary Data Sets and Auxiliary Scripts:
- Fig. S14: Simulation Based Calibration of Inducer Binding Mutant Statistical
Models
Used to plot z-scores, shrinkage, and rank distributions for inducer binding domain models. - Fig. S15 - Fig. S16: Posterior Predictive Checks For Inducer Binding Domain
Models
Plots the MCMC samples and posterior predictive checks for both inducer binding domain statistical models for the mutant Q294K paired with the O2 operator.- Necessary Data Sets and Auxiliary Scripts:
- Fig. S17 - Fig. S18: Comparison of Fit Strain Choice on Prediction of Inducer
Binding Domain
Mutants
Compares the effect of the choice of fit strain under both inducer binding domain statistical models on predicting induction profiles. - Fig. S19: Influence of Choice of Fit Strain on ∆F Predictions for Inducer
Binding Domain
Mutants
Shows the predicted change in free energy for all choices of fit strain for inference of allosteric parameters. - Fig. S20: Global DNA Binding Energy Inference Induction Profiles and ∆F
Shows the fits of the induction profiles for each DNA binding mutant after global estimation of the DNA binding energy. It also shows the predicted ∆F along with the inferred free energies. - Fig. S21: Global Allosteric Parameter Inference Induction Profiles and ∆F
Shows the fits of the induction profiles for each inducer binding mutant after global estimation of the allosteric parameters. It also shows the predicted ∆F along with the inferred free energies.- Necessary Data Sets and Auxiliary Scripts:
- Summarized fold-change measurements
- Empirical free energy inference statistics
- Global allosteric parameter inference samples
- [Global inference of allosteric parameters ](/mwc_mutants/code/Chure2019_pooled_parameter_inference.py
- Stan model for global inference of allosteric parameters
- Necessary Data Sets and Auxiliary Scripts: