
Analysis files
Tutorials
This page contains Jupyter notebook tutorials for each major data analysis section in the publication. You can either read our analysis rendered in HTML or download the .ipynb file and run the analysis on your own machine. All necessary data files can be accessed from the data page.
-
Supplemental Information B - Unsupervised Gating | An example of how our automated gating function works on raw flow cytometry data. [
.ipynbfile] -
Supplemental Information C - Single-Cell Microscopy | An example of how microscopy images were processed including single-cell segmentation and correction for non-uniform illumination. [
.ipynbfile] -
Supplemental Information E - Bayesian Parameter Estimation | A notebook covering the procedure of estimating parameter values using a Bayesian definition of probability. [
.ipynbfile] -
Supplemental Information E - Global Parameter Estimation | An annotated and thorough description of our parameter estimation considering all known sources of error for the model parameters.[
.ipynbfile] -
Supplemental Information E - Nonlinear Regression | An example of how nonlinear regression was used to generate the starting positions of the MCMC walkers, as was used in the global parameter estimation notebook. [
.ipynbfile] -
Supplemental Information H - Sensitivity Analysis | An explanation and analysis of how changes in the inducer dissociation constants values influence the credible region of the predicted fold-change in gene expression. [[
.ipynbfile]]
Example Scripts
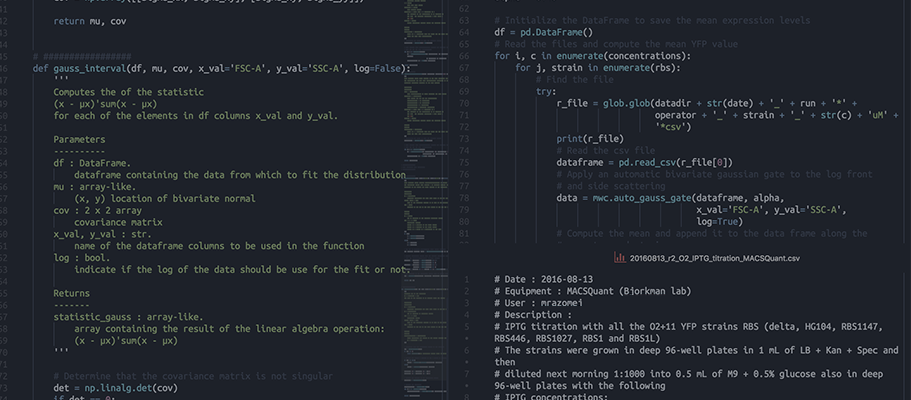
Our experimental pipeline included two Python scripts used for processing the raw flow cytometry data and generating quality control plots. These scripts generated files that were saved to disk after each run.
-
Example
example_processing.pyfile | This script reads in flow cytometry measurements from a.csvfile, employs an unsupervised gating algorithm, computes the experimental fold-change in gene expression, and saves two.csvfiles with said fold-change values. -
Example
analysis.pyfile | This script reads in the fold-change.csvfile generated byexample_processing.pyand generates a plot of the intensity as a function of IPTG concentration as well as a titration of fold-change in the absence of inducer as a function of repressor copy number.
Other Languages
All analysis was also performed in Mathematica by Tal Einav. This document can be downloaded below.