Code and Data
Code
-
batch_processing.py | Iterates through all preprocessed image data, parses clist.mat data, reconstructs linages from growth series, and computes the fold-change in gene expression. This script is designed to be run from the “processing” root folder directory.
-
analyze_dilution_data.py | Given compiled data mapping lineages and fold-change measurements, this script performs statistical inference on the fluctuations to infer the calibration, coupled with calculation of the repressor copy number.
-
empirical_F_inference.py | Given measurements of the fold-change in gene expression, this script infers the posterior distribution of the observed free energy.
-
entropic_parameter_inference.py | Infers the entropic parameters and from a collection of fold-change measurements at different temperatures. This can be run on all data simultaneously or on individual temperatures by toggling the “pooled” variable at the top of the script.
-
DNA_binding_energy_estimation.py | Infers an effective DNA binding energy from a collection of fold-change measurements.
-
systematic_error_binding_energy_inference.py | Infers an effective DNA binding energy under a variety of scenarios where cell size is considered.
-
calibration_factor.stan | Inferrential model for estimation of the calibration factor given sibling cell intensities
-
DNA_binding_energy.stan | Inferrential model for the estimation of the DNA binding energy given fold-change measurements
-
empirical_F_inference.stan | Inferrential model for the estimation of the free energy from fold-change measurements.
-
entropy_estimation.stan | Inferrenetial model for inferring the entropic parameters and for a single temperature.
-
pooled_entropy_estimation.stan | Inferrential model for the estimation of the entropic parameters and for multiple temperatures together.
Data Sets
-
clist.mat files from segmentation | (filetype: .zip)(100 MB) DOI: 10.22002/D1.1315
-
Raw compiled lineage information. | (filetype: .csv)
-
Raw compiled snapshots of ATC conditions. | (filetype: .csv)
-
Analyzed lineage data with estimated calibration factor. | (filetype: .csv)
-
Analyzed snapshot data with fold-change and repressor count. | (filetype: .csv)
Main Text Figure Generation
Used to generate panels B and C from figure 1 showing representative growth curves and a jitter plot of the growth rate.
Necessary Data Sets• Compiled growth rate statistics
• Compiled growth curve measurements
Used to generate Figure 2 panel B, illustrating the anticorrelation between mCherry and YFP channels.
Necessary Data Sets• Compiled fold-change measurements with repressor counts.
Generates a representative plot showing the intensity variance as a function of the summed intensity with the best estimate of the calibration factor.
Necessary Data Sets• Analyzed sibling cell intensities
Plots the dependence of cell volume and repressor expression as a function of the growth rate. Note that this script generates the plots. The text labels were added after the fact in Adobe Illustrator.
Necessary Data Sets• Compiled fold-change measurements with repressor counts
• Analyzed sibling cell intensities
• Compiled growth rate statistics
Plots the summarized fold-change in gene expression against the predictions along with the free energy shift ∆F for conditions with differing carbon sources. Note that the labels ("acetate", "glycerol", "example", etc) along with boxes delinating A, B, and C were added after the fact using Adobe Illustrator.
Necessary Data Sets• Compiled fold-change measurements with repressor counts
• Inferred free energies from fold-change data
Plots the summarized fold-change in gene expression against the predictions along with the free energy shift ∆F for conditions with differing temperatures.
Necessary Data Sets• Compiled fold-change measurements with repressor counts
• Inferred free energies from fold-change data
• MCMC samples from entropic parameter estimation
Plots the data collapse of various data sets onto the single master curve.
Necessary Data Sets• Compiled fold-change measurements with repressor counts
• Inferred free energies from fold-change data
• MCMC samples from entropic parameter estimation
• Fold-change measurements from Garcia and Phillips 2011 and Brewster et al. 2014
• Fold-change measuremetns from Razo-Mejia et al. 2018
• Fold-change measurements of repressor mutants from Chure et al. 2019
• DNA binding energy estimates for repressor mutants in Chure et al. 2019
• Dissociation constant and allosteric energy estimates for mutants in Chure et al. 2019
SI Text Figure Generation
Plots a representative growth curve for the glycerol condition, the best fit using Gaussian process modeling, and a plot of the maximum growth rate as a function of time.
Necessary Data Sets• Representative data from a 96-well growth experiment
• Gaussian process modeling output on a glycerol growth curve.
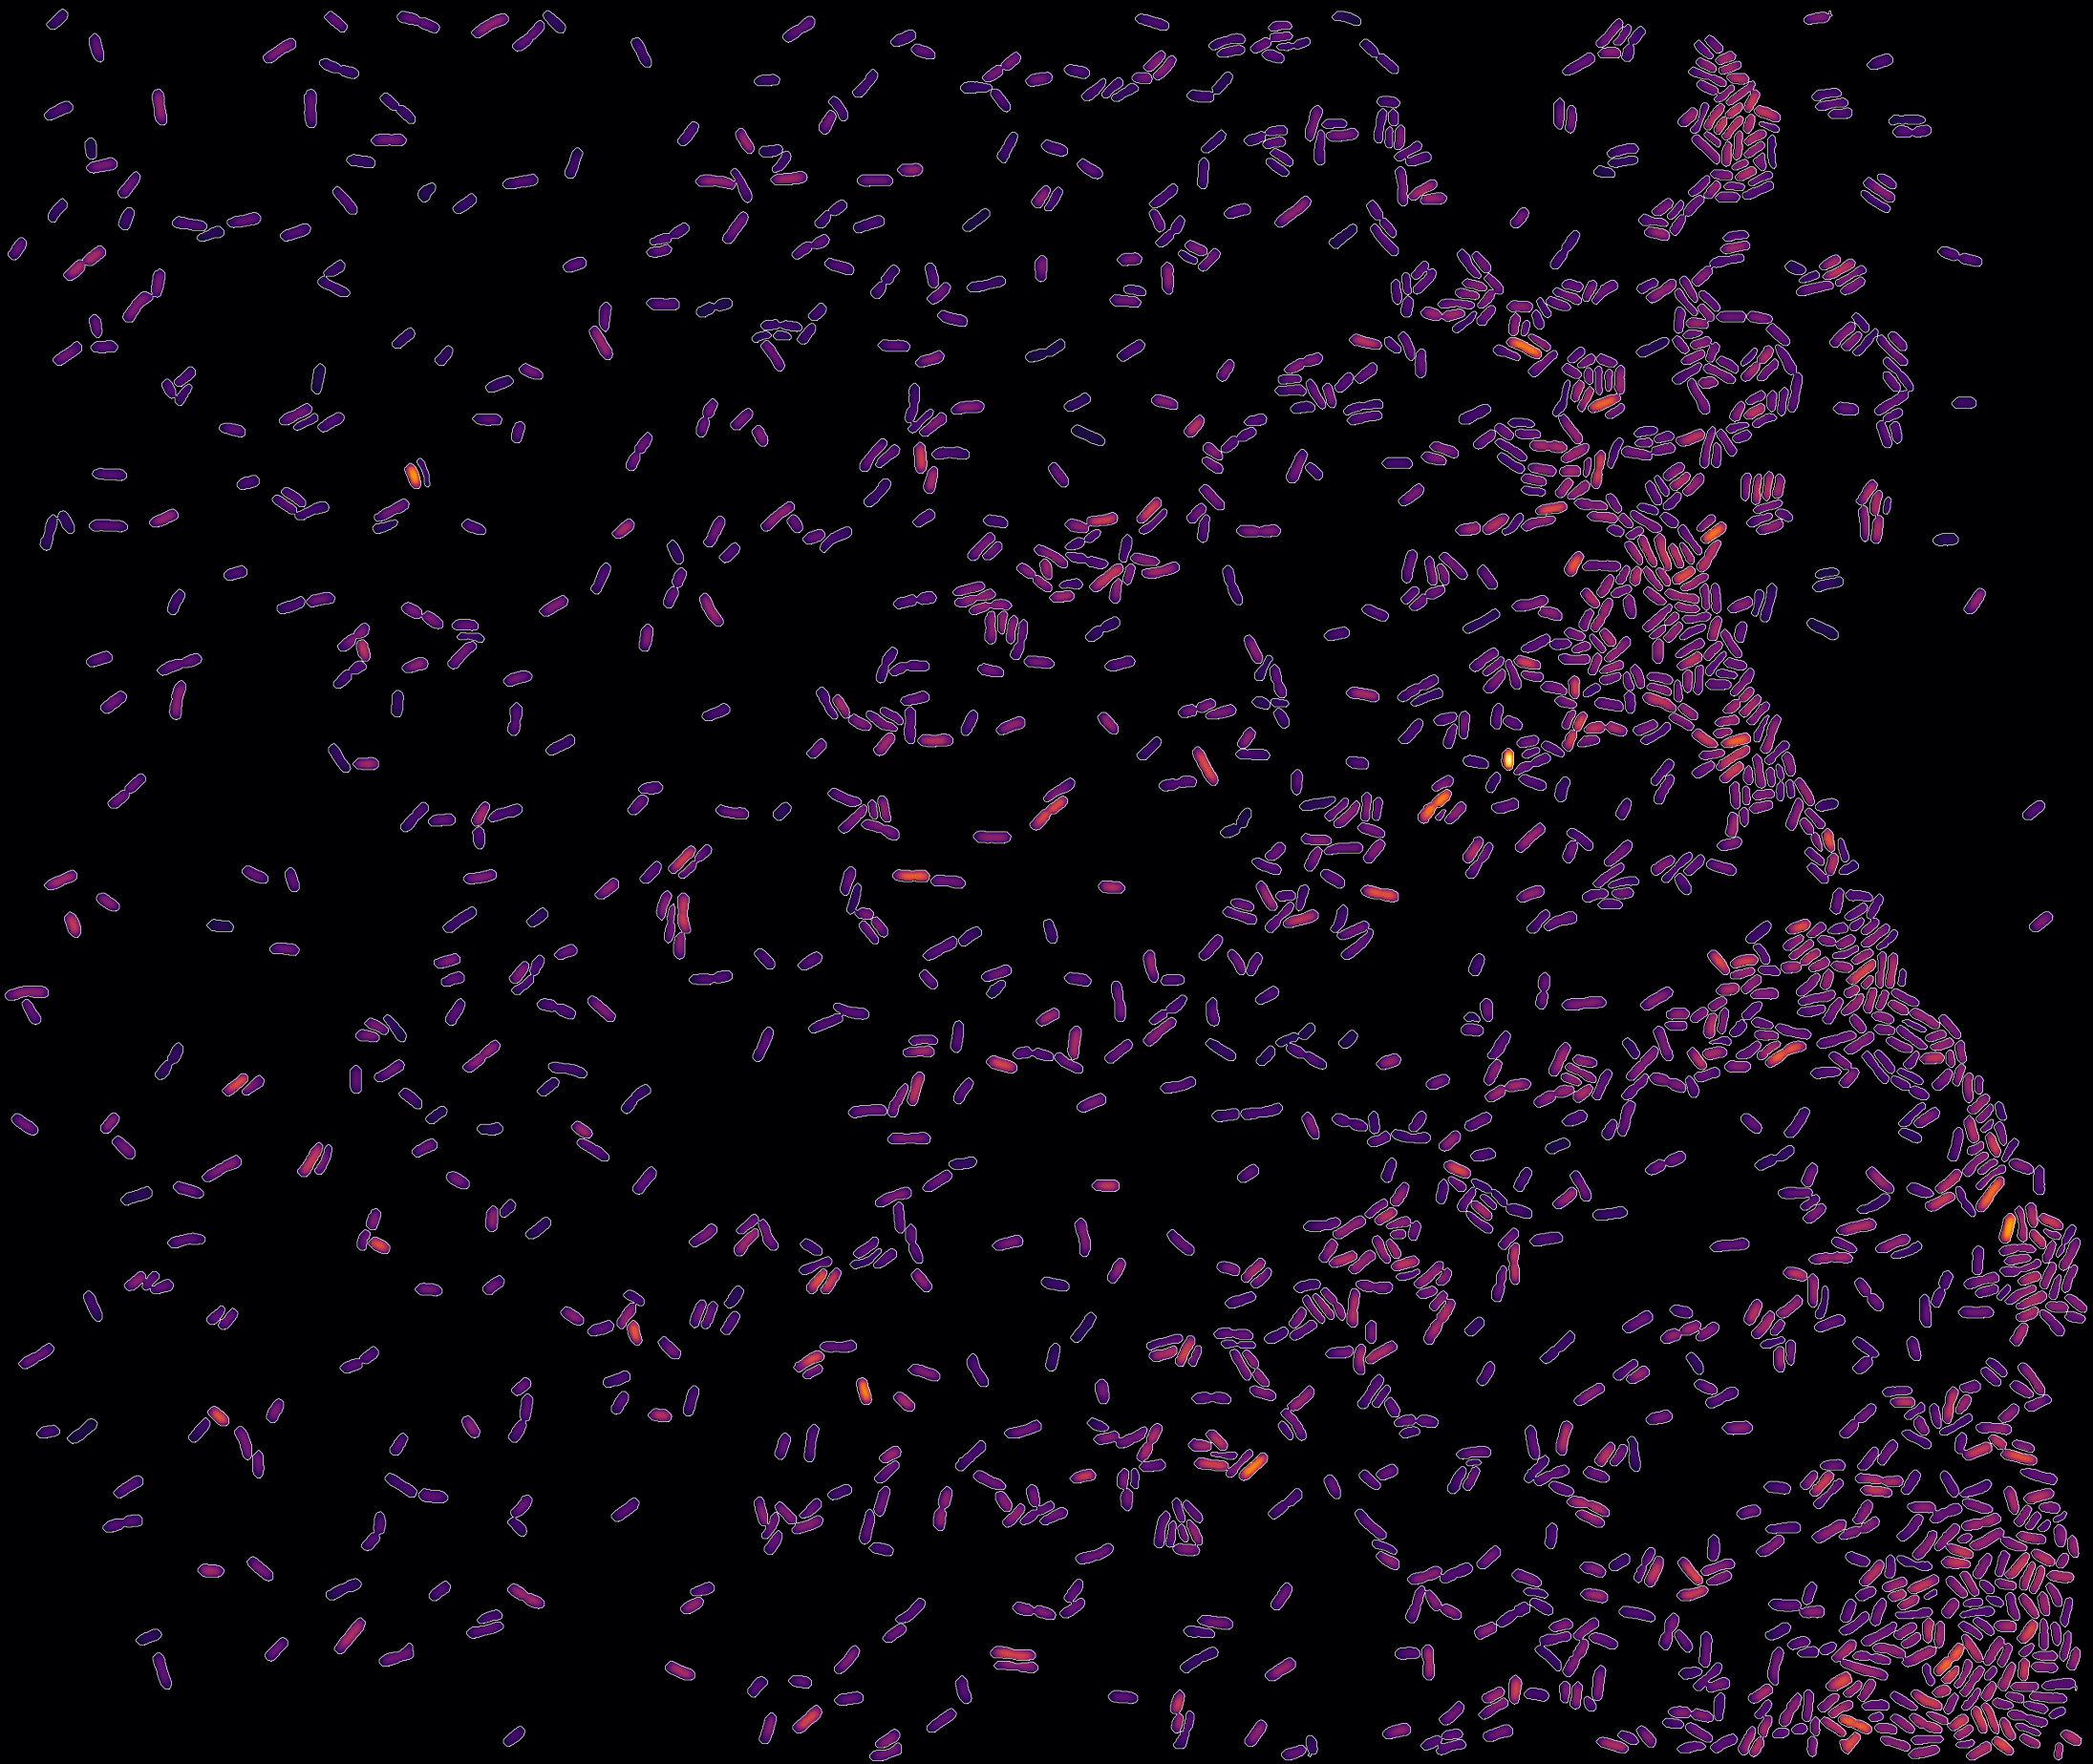
This script plots the segmented borders of cells for all conditions overlaid with an approximation of the shape as a spherocylinder projected in two dimensions.
Necessary Data Sets• Example .mat files from segmentation
This script calculates and plots several data validation statistics to ensure that lineage tracking is working as expected.
Necessary Data Sets• Compiled intensity measurements of sibling cells
Generates a figure showing histograms and empirical cumulative distributions of the posterior probability density of the calibration factor.
Necessary Data Sets• Compiled intensities of sibling cells
Necessary Stan Models
• Calibration factor inference model
This script plots the observed cell length distributions in all conditions from both the snapshots and the newborn cell sizes.
Necessary Data Sets• Compiled intensities of sibling cells
• Compiled fold-change in gene expression and repressor counts
This script plots a series of cell size corrections for the repressor counts as well as the estimated DNA binding energy for each.
Necessary Data Sets• Compiled fold-change in gene expression and repressor counts
• Estimated DNA binding energies for different correction regimes
• Fold-change measurements from Garcia and Phillips 2011 and Brewster et al. 2014
• Fold-change measuremetns from Razo-Mejia et al. 2018
Creates a "corner plot" showing all joint and marginal posterior distributions from the inference of the effective DNA binding energy
Necessary Data Sets• MCMC samples of effective DNA binding energy and homoscedastic error
• Summaries of effective DNA binding energy and homoscedastic error
Plots the predicted fold-change in gene expression using each individual carbon source along with all possible data sources.
Necessary Data Sets• Compiled fold-change in gene expression measurements and repressor counts
• Summaries of effective DNA binding energy and homoscedastic error
Creates a "corner plot" showing all joint and marginal posterior distributions from the inference of the entropic parameters and homoscedastic error.
Necessary Data Sets• MCMC samples of entropic parameter inference on single temperatures
• MCMC samples of entropic parameter inference on all temperatures simultaneously
Plots the predicted fold-change for each individual temperature with all possible combinations of data for comparison.
Necessary Data Sets• Compiled fold-change in gene expression and repressor counts
• MCMC samples of entropic parameter inference on single temperatures
• MCMC samples of entropic parameter inference on all temperatures simultaneously