Code and Data
Executing the code
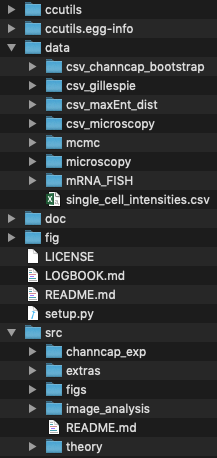
The code provided here was written to be ran in a particular file structure. The structure looks like
The entire repository can be cloned via GitHub. This repo does not contain the data, but all data is provided in the links bellow. Please follow the installation instructions on the GitHub repository.
Computational environment
All analysis and data processing was performed with the following software configurations.
# Python Version
CPython 3.7.4
IPython 7.11.1

# Package versions
scipy==1.3.1
scikit_image==0.15.0
matplotlib==3.1.1
maxentropy==0.3.0
seaborn==0.9.0
pandas==0.25.3
numpy==1.18.1
GitPython==3.1.0
mpmath==1.1.0
skimage==0.0
emcee==2.2.1
sympy==1.5.1
cloudpickle==1.2.2
joblib==0.14.1
statsmodels==0.10.1
dill==0.3.1.1
ccutils==0.1.5


# System information
compiler   : Clang 4.0.1 (tags/RELEASE_401/final)
system     : Darwin
release    : 18.7.0
machine    : x86_64
processor  : i386
CPU cores  : 8
interpreter: 64bit
The ccutils Module
This work required several home-made Python functions. To ensure reproducibility, we have written it as a Python module that can be installed from the master branch of the GitHub repository. Please see the installation instructions for details. This module is required to execute all of the following scripts.
Jupyter Notebooks
This section contains detailed code in the format of Jupyter notebooks. These notebooks extensively explain the logic behind the computations that went into each of the sections with highly annotated Markdown text. The notebooks can be viewed as html files or can be downloaded as ipynb to be executed. When necessary, there is a link to download the data used for the computations in the notebook.
- chemical_master_mRNA_FISH_mcmc
| [ipynb file]
-
Bayesian inference of the RNAP parameters based on single-molecule FISH data (See SI section S2).
Necessary Data Sets
-
- chemical_master_steady_state_moments_general
| [ipynb file]
- Analytical computation of the moments of the steady state mRNA and protein distribution assuming no variability in gene dosage (See SI section S3).
- moment_dynamics_system
| [ipynb file]
- Analytical computation of the dynamical equations describing the time evolution of the moments of the mRNA and protein distribution (See SI section S3).
- binomial_moments
| [ipynb file]
- Analytical computation of the prefactors to compute the moments of the mRNA and protein distribution after the binomial partitioning of the mRNA and protein that takes place during cell division (See SI section S4.1).
- moment_dynamics_cell_division
| [ipynb file]
-
Numerical integration of the mRNA and protein moment dynamical equations taking into account gene dosage variability during the cell cycle (See SI section S4).
Necessary Data Sets
• Bootstrap gene expression fold-change and gene expression noise.
• sympy-generated matrix to compute moments of the mRNA and protein distribution after cell division.
-
- MaxEnt_approx_joint
| [ipynb file]
-
Numerical calculation of the Lagrange multipliers to reconstruc the maximum entropy mRNA and protein distribution based on the moments of the distribution (See SI section S5).
Necessary Data Sets
-
- gillespie_simulation
| [ipynb file]
-
Implementation of the Gillespie algorithm to generate stochastic dynamical trajectories of the mRNA and protein counts (See SI section S6).
Necessary Data Sets
-
- blahut_algorithm_channel_capacity
| [ipynb file]
-
Numerical computation of the predicted channel capacity using the Blahut-Arimoto algorithm (See SI section S7).
Necessary Data Sets
• Theoretical channel capacity for different biophysical parameters.
-
- empirical_constants
| [ipynb file]
-
Empirical fixes to the disagreement between theoretical and experimental noise in gene expression. These explorations aim to aid the next generation of theory-experiment comparison to find a foundational reason for the systematic underestimate of the cell-to-cell variability
Necessary Data Sets
-
- image_analysis_pipeline
| [ipynb file]
- Image processing pipeline to extract single-cell fluorescence values.
- channel_capacity_bias_correction
| [ipynb file]
- Numerical determination of the channel capacity from single-cell fluoresence values. (See SI section S7)
Python scripts
This section lists python scripts used to compute repetitive tasks explained in the Jupyter notebooks. When necessary, there is a link to download the data used for the computations in the notebook.
-
- This script computes in parallel the average moments of the mRNA and protein distribution for a fine grid of IPTG values with the experimentally explored repressor copy numbers only.
-
- This script computes in parallel the average moments of the mRNA and protein distribution for a fine grid of repressor copy number values with the 12 experimental IPTG concentrations.
-
mdcd_repressor_extended_range.py
- This script computes in parallel the average moments of the mRNA and protein distribution for a grid of repressor up to 10^6 copy number values with the 12 experimental IPTG concentrations.
-
- This script computes in parallel the average moments of the mRNA and protein distribution for the experimentally measured combinations of operators and repressors, but this time using the global parameter inferences as reported in Chure et. al, 2019 that phenomenologically capture better the induction profile for the O3 operator and the general steepness of the other strains.
- maxent_protein_dist.py
| [data]
- Script that takes the protein distribution moments as inferred from the numerical integration of the dynamical equations and computes the corresponding Lagrange multipliers for a maximum entropy approximation of the distribution.
- maxent_mRNA_dist.py
| [data]
- Script that takes the mRNA distribution moments as inferred from the numerical integration of the dynamical equations and computes the corresponding Lagrange multipliers for a maximum entropy approximation of the distribution.
- maxent_protein_dist_rep_range.py
| [data]
- Script that takes the protein distribution moments as inferred from the numerical integration of the dynamical equations and computes the corresponding Lagrange multipliers for a maximum entropy approximation of the distribution for a larger span of repressor copy numbers.
- maxent_protein_dist_iptg_range.py
| [data]
- Script that takes the protein distribution moments as inferred from the numerical integration of the dynamical equations and computes the corresponding Lagrange multipliers for a maximum entropy approximation of the distribution for a finer grid of inducer concentrations.
- maxent_protein_dist_correction.py
| [data]
- Script that updates the second and third moment of the protein distribution to match the factor of two in the deviation between the original theoretical prediction and the experimental data. It then uses these updated moments along with the first protein moment to infer the maximum entropy distribution.
- channcap_protein_multi_prom.py
| [data]
- Script that computes the channel capacity for the protein distributions generated with the output of the
maxent_protein_dist.pyscript.
- Script that computes the channel capacity for the protein distributions generated with the output of the
- channcap_mRNA_multi_prom.py
| [data]
- Script that computes the channel capacity for the mRNA distributions generated with the output of the
maxent_mRNA_dist.pyscript.
- Script that computes the channel capacity for the mRNA distributions generated with the output of the
- channcap_protein_multi_prom_rep_range.py
| [data]
- Script that computes the channel capacity for the protein distributions generated with the output of the
maxent_protein_dist_rep_range.pyscript.
- Script that computes the channel capacity for the protein distributions generated with the output of the
- channcap_protein_multi_prom_iptg_range.py
| [data]
- Script that computes the channel capacity for the protein distributions generated with the output of the
maxent_protein_dist_iptg_range.pyscript.
- Script that computes the channel capacity for the protein distributions generated with the output of the
- channcap_protein_single_prom.py
| [data]
- Script that computes the channel capacity for the protein distributions generated assuming a single promoter that reaches steady state. These calculations do not include the gene dosage variability during the cell cycle, and assume a Poissonian degradation of the proteins.
Data Sets
This section lists all datasets used for this work. From the raw microscopy images, to the processed single-cell fluorescence values. Also here we list all values generated from theoretical calculations that are computationally expensive to reproduce every single time.
-
Single-molecule mRNA counts from Jones et al., 2014. | (filetype: .csv)(4.1 MB)
-
Raw microscopy images | (filetype: .zip)(23.4 GB)
-
Single-cell microscopy fluorescence values. | (filetype: .csv)(28 MB)
-
Bootstrap gene expression fold-change and gene expression noise. | (filetype: .csv)
-
sympy-generated matrix to compute moments after cell division | (filetype: .zip)
-
mRNA and protein joint distribution moments as computed from dynamical equations over an entire cell cycle. | (filetype: .csv)
-
mRNA and protein joint distribution moments as computed from steady-state solutions of moment equations for a single promoter. | (filetype: .csv)
-
mRNA and protein joint distribution moments as computed from dynamical equations over an entire cell cycle over a finer inducer concentration grid. | (filetype: .csv)
-
mRNA and protein joint distribution moments as computed from dynamical equations over an entire cell cycle over a larger repressor copy number grid. | (filetype: .csv)
-
Lagrange multipliers for maximum entropy mRNA disributions. | (filetype: .csv)
-
Lagrange multipliers for maximum entropy protein disributions. | (filetype: .csv)
-
Lagrange multipliers for maximum entropy protein disributions assuming a single-promoter at steady state. | (filetype: .csv)
-
Lagrange multipliers for maximum entropy protein disributions for finer inducer concentration range. | (filetype: .csv)
-
Lagrange multipliers for maximum entropy protein disributions for extended repressor count. | (filetype: .csv)
-
Lagrange multipliers for maximum entropy protein disributions with a numerical correction for the 2nd and 3rd moment of the distribution. | (filetype: .csv)
-
Theoretical channel capacity at mRNA level for multi-promoter model. | (filetype: .csv)
-
Theoretical channel capacity at protien level for multi-promoter model. | (filetype: .csv)
-
Theoretical channel capacity at protien level for single-promoter model. | (filetype: .csv)
-
Theoretical channel capacity at protien level for multi-promoter model for a finer grid of inducer concentrations. | (filetype: .csv)
-
Theoretical channel capacity at protien level for multi-promoter model for a larger grid of repressor copy numbers. | (filetype: .csv)
-
sympy-generated matrix to compute distribution moment dynamics for two-state unregulated promoter model | (filetype: .zip)
-
sympy-generated matrix to compute distribution moment dynamics for three-state regulated promoter model | (filetype: .zip)